

Chemical prices you can defend in a negotiation
Price history, landed-cost build-up, demand and supply, and a forward view for chemicals across the petrochemical value chain. Every layer shows its basis, and your team can change the assumptions.
AI reconciles the demand, supply and pricing layers as they move and flags where a market has drifted from its fundamentals; every layer still carries its own basis and confidence tier.
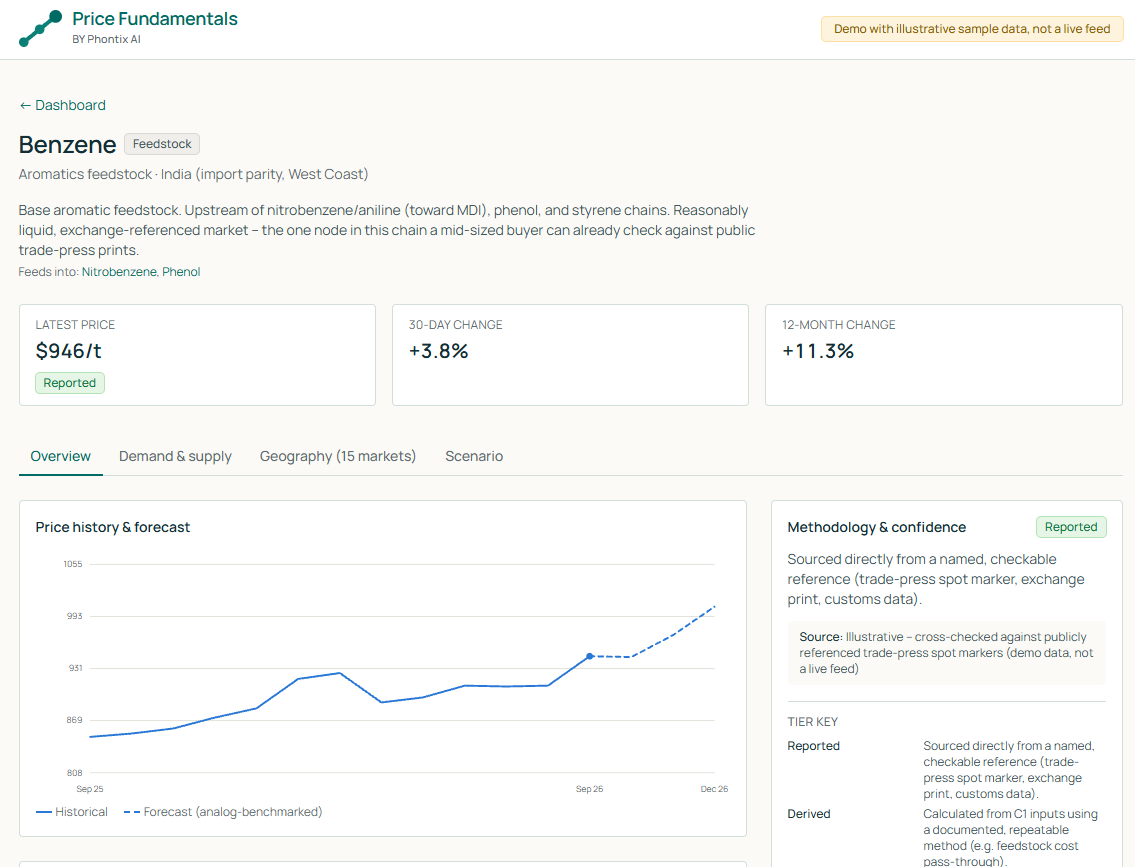

A price is only useful if you can defend it
Most price intelligence arrives as a figure with a date attached. That is enough to report a market. It is not enough to negotiate in one.
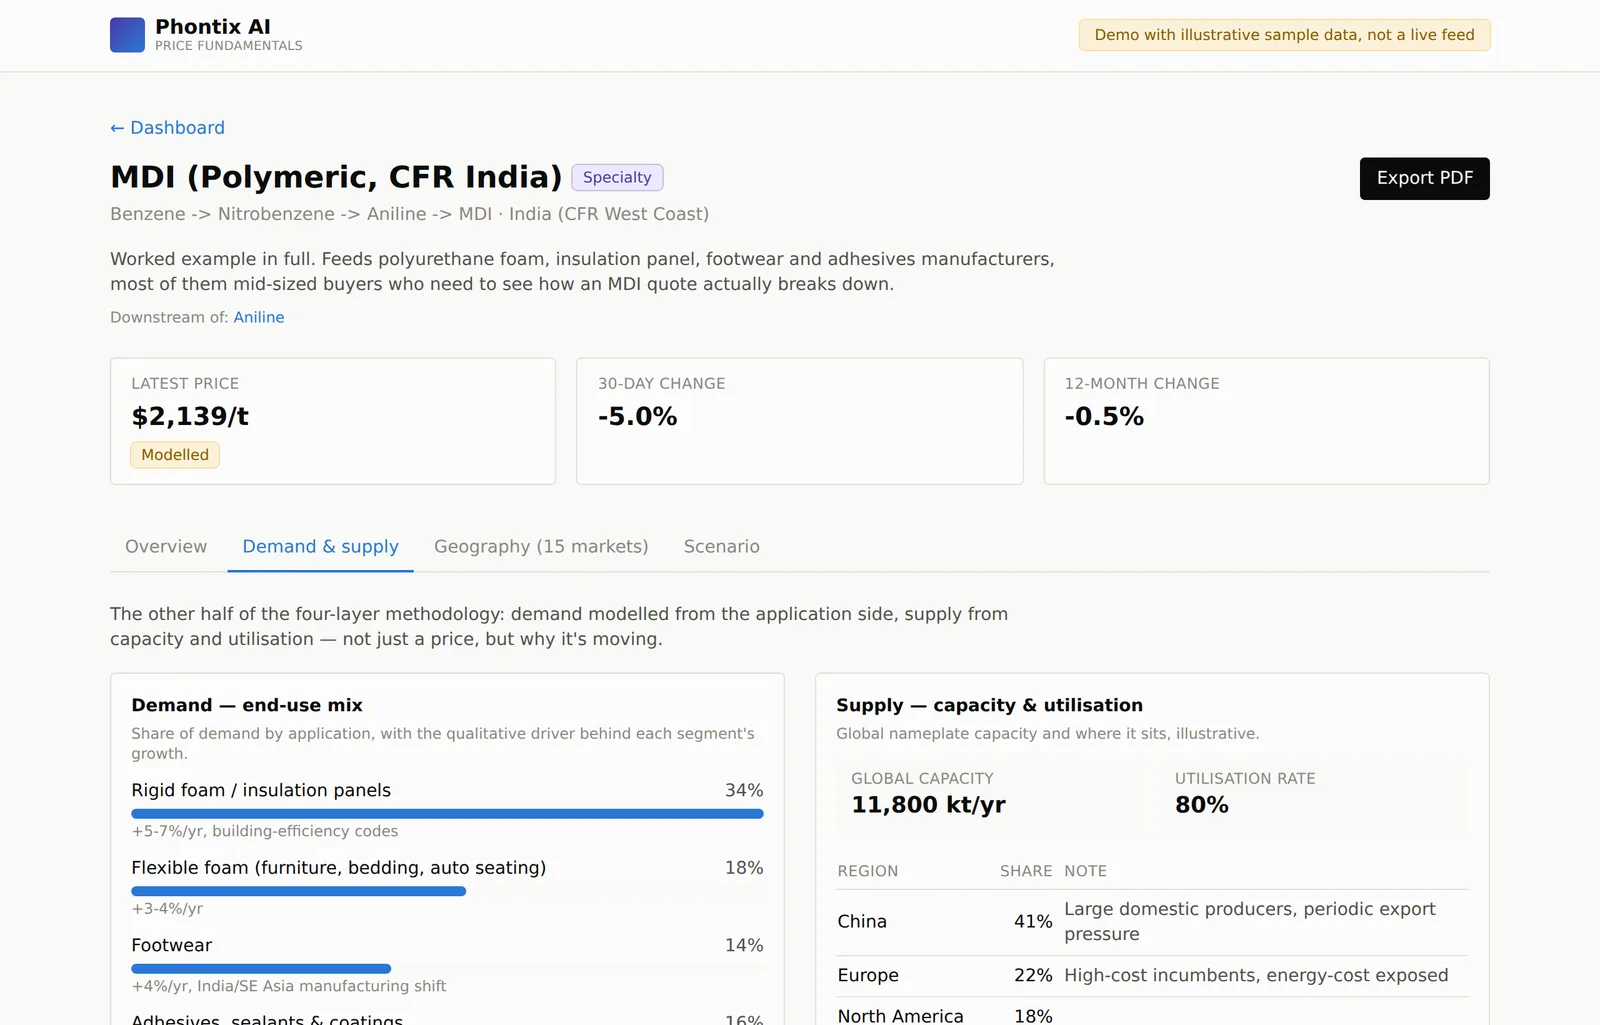
Price Fundamentals uses a net consumption approach: demand is modelled from the application side, supply from capacity and utilisation, and price movement is explained through the variables actually driving it. Every forecast can be traced back to its assumptions, and those assumptions can be changed.
When your category manager is challenged on a number in a supplier meeting, they can show their working.
Who it is for
Teams that buy chemicals for a living and need more than an index they cannot explain.
Mid-sized procurement teams
"Is this quote fair, and what should we push back on?" A should-cost view of each layer, priced for Indian delivery.
Specialty chemical buyers
"What happens to my price if benzene moves?" Upstream links from feedstock to the product you buy.
Commercial strategy teams
"Where is capacity going, and who takes the demand?" End-use mix, utilisation and regional share in one view.
What sits inside a chemical view
Each chemical carries the same structure, so a buyer can move between them without relearning the format.
Price history and benchmarks
Regional price series with the basis and source stated, and a forward view benchmarked against comparable cycles.
Landed-cost build-up
Feedstock, conversion, margin, duty and freight, reconciled to the observed price, each line with its confidence tier.
Demand and supply
End-use application mix on the demand side, and capacity, utilisation and regional capacity share on the supply side.
Fifteen markets, three tiers
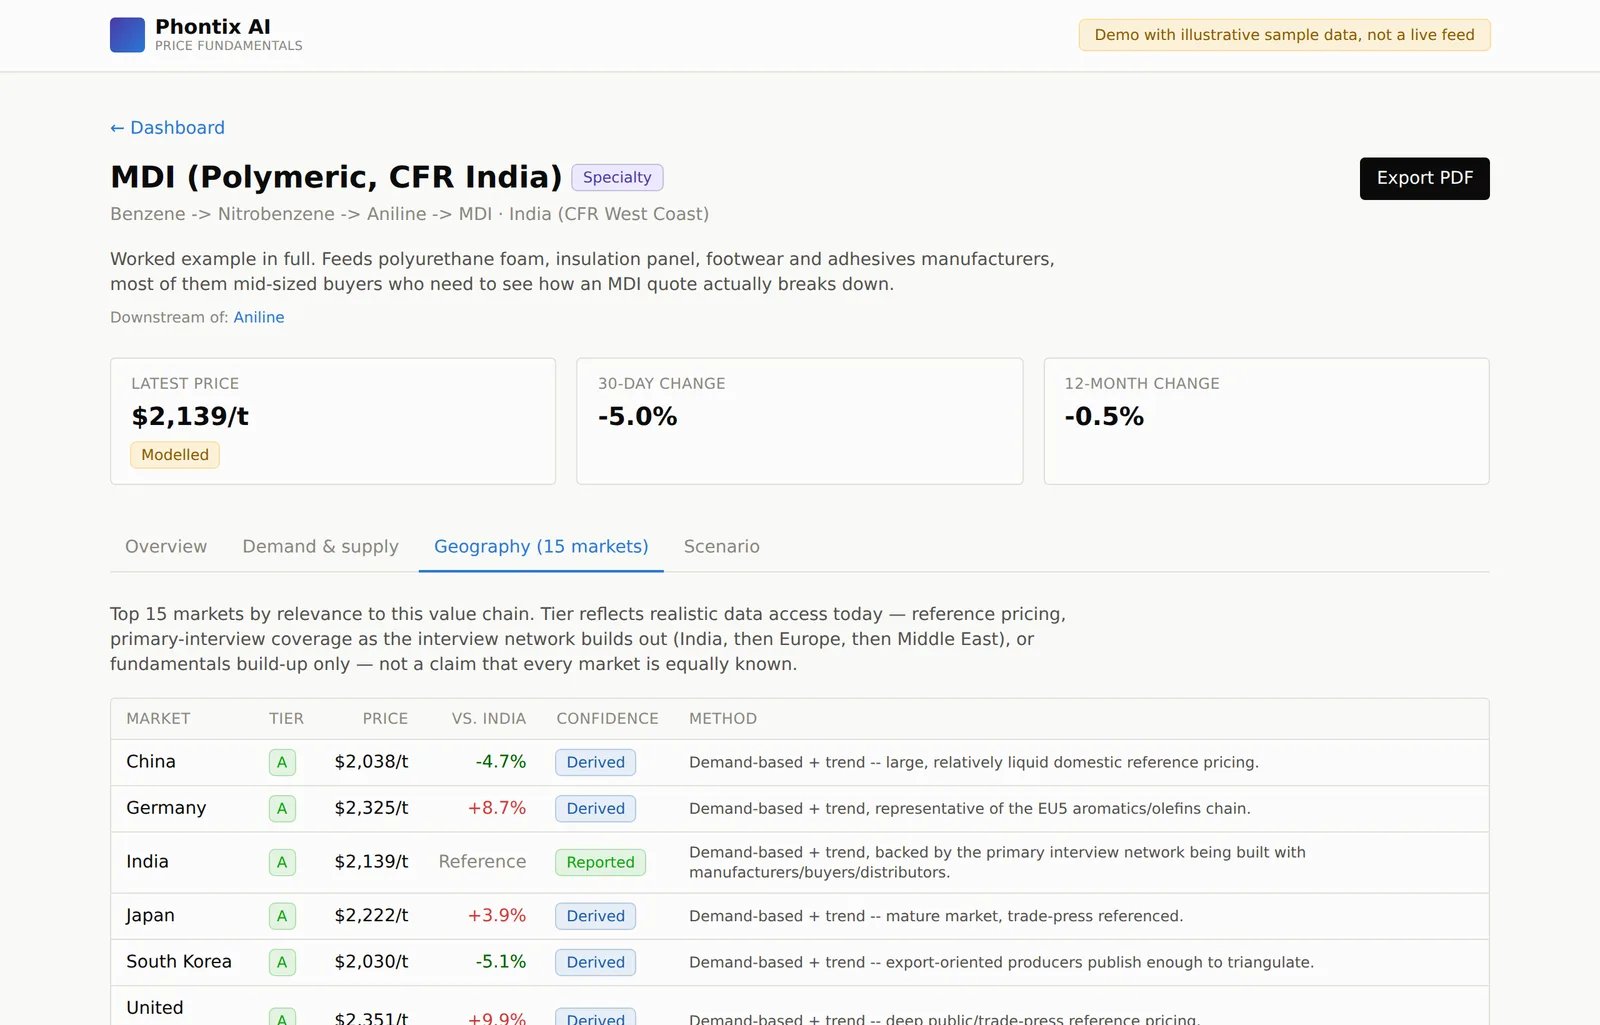
The same chemical priced across 15 markets, tiered by how well each is actually sourced rather than by size.
Scenario controls
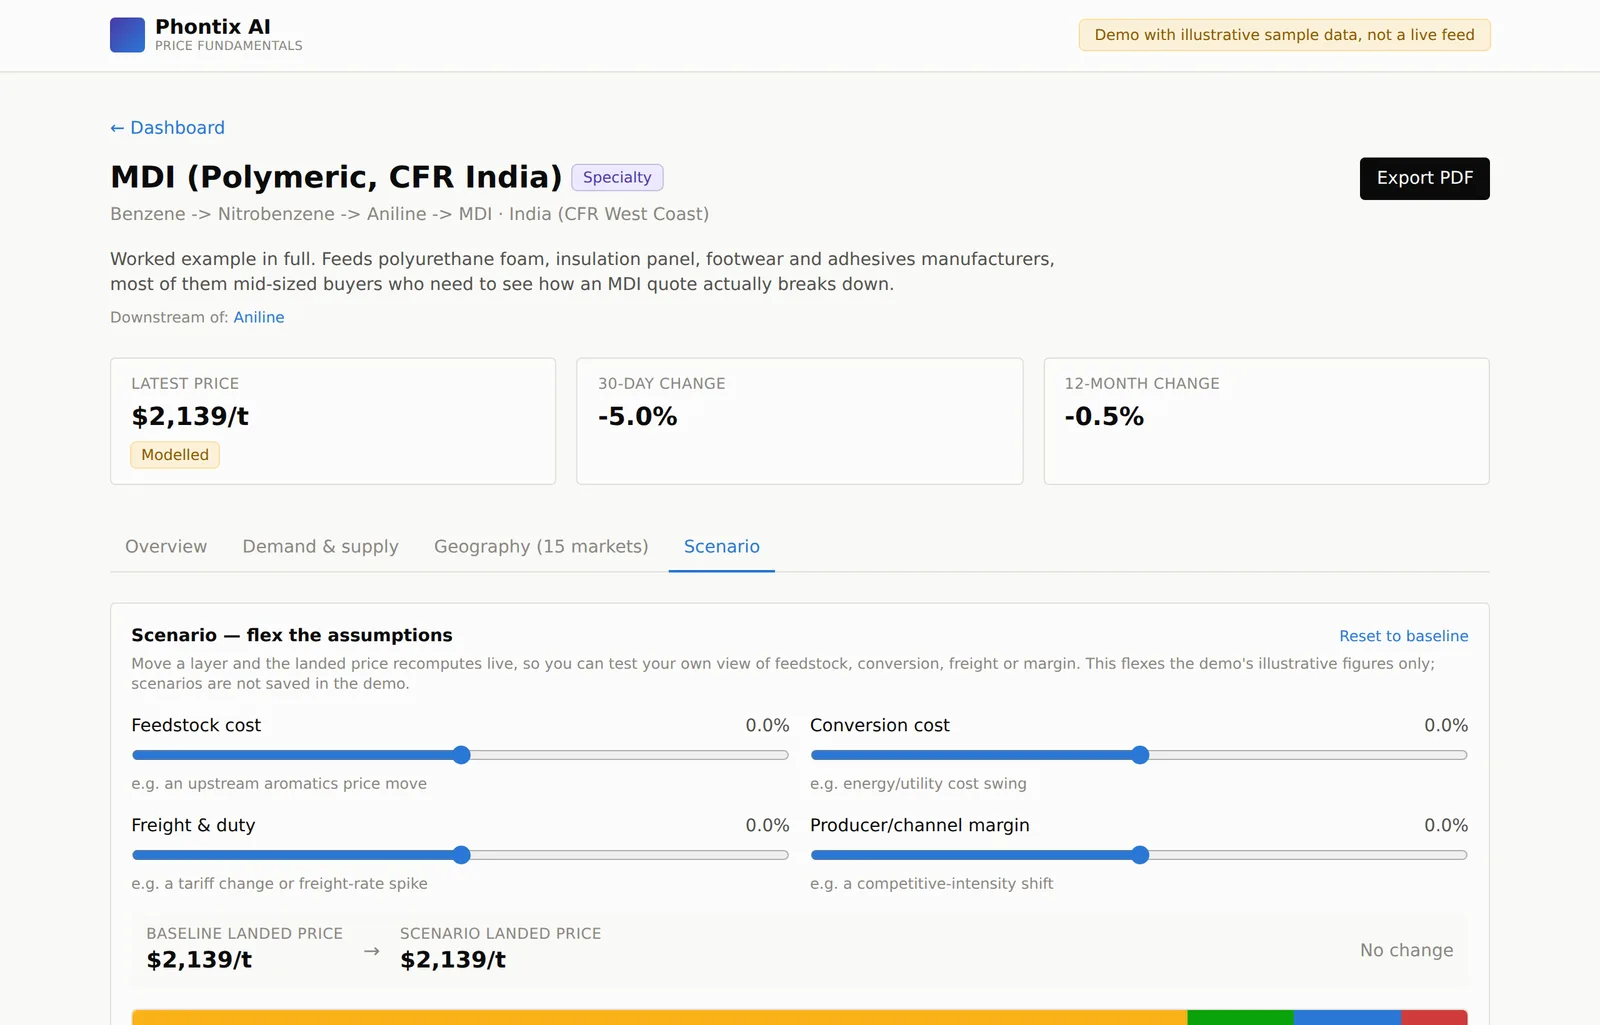
Move feedstock, conversion, freight and duty or margin and watch the landed price recalculate.
Dossiers and exports
A PDF dossier per chemical, and structured exports for your own cost models.
Initial coverage
We started with one real value chain and priced it properly, rather than listing hundreds of chemicals thinly. New chemicals are added on subscriber request.
Value chain
- Benzene, aromatics feedstock
- Nitrobenzene, first conversion step
- Aniline, direct feedstock into MDI
- MDI, for foams, insulation, footwear and adhesives
Also tracked: phenol, BPA, caprolactam and PTA.
Market tiers
| Tier | Basis | Markets |
|---|---|---|
| A | Reference pricing and primary interview base | India, China, South Korea, Japan, United States, Germany |
| B | Primary interview coverage in build-out, cross-checked by fundamentals | Saudi Arabia, UAE, Thailand, Indonesia, Vietnam |
| C | Fundamentals build-up only | Brazil, Turkey, Mexico, South Africa |
Worked example: MDI into India
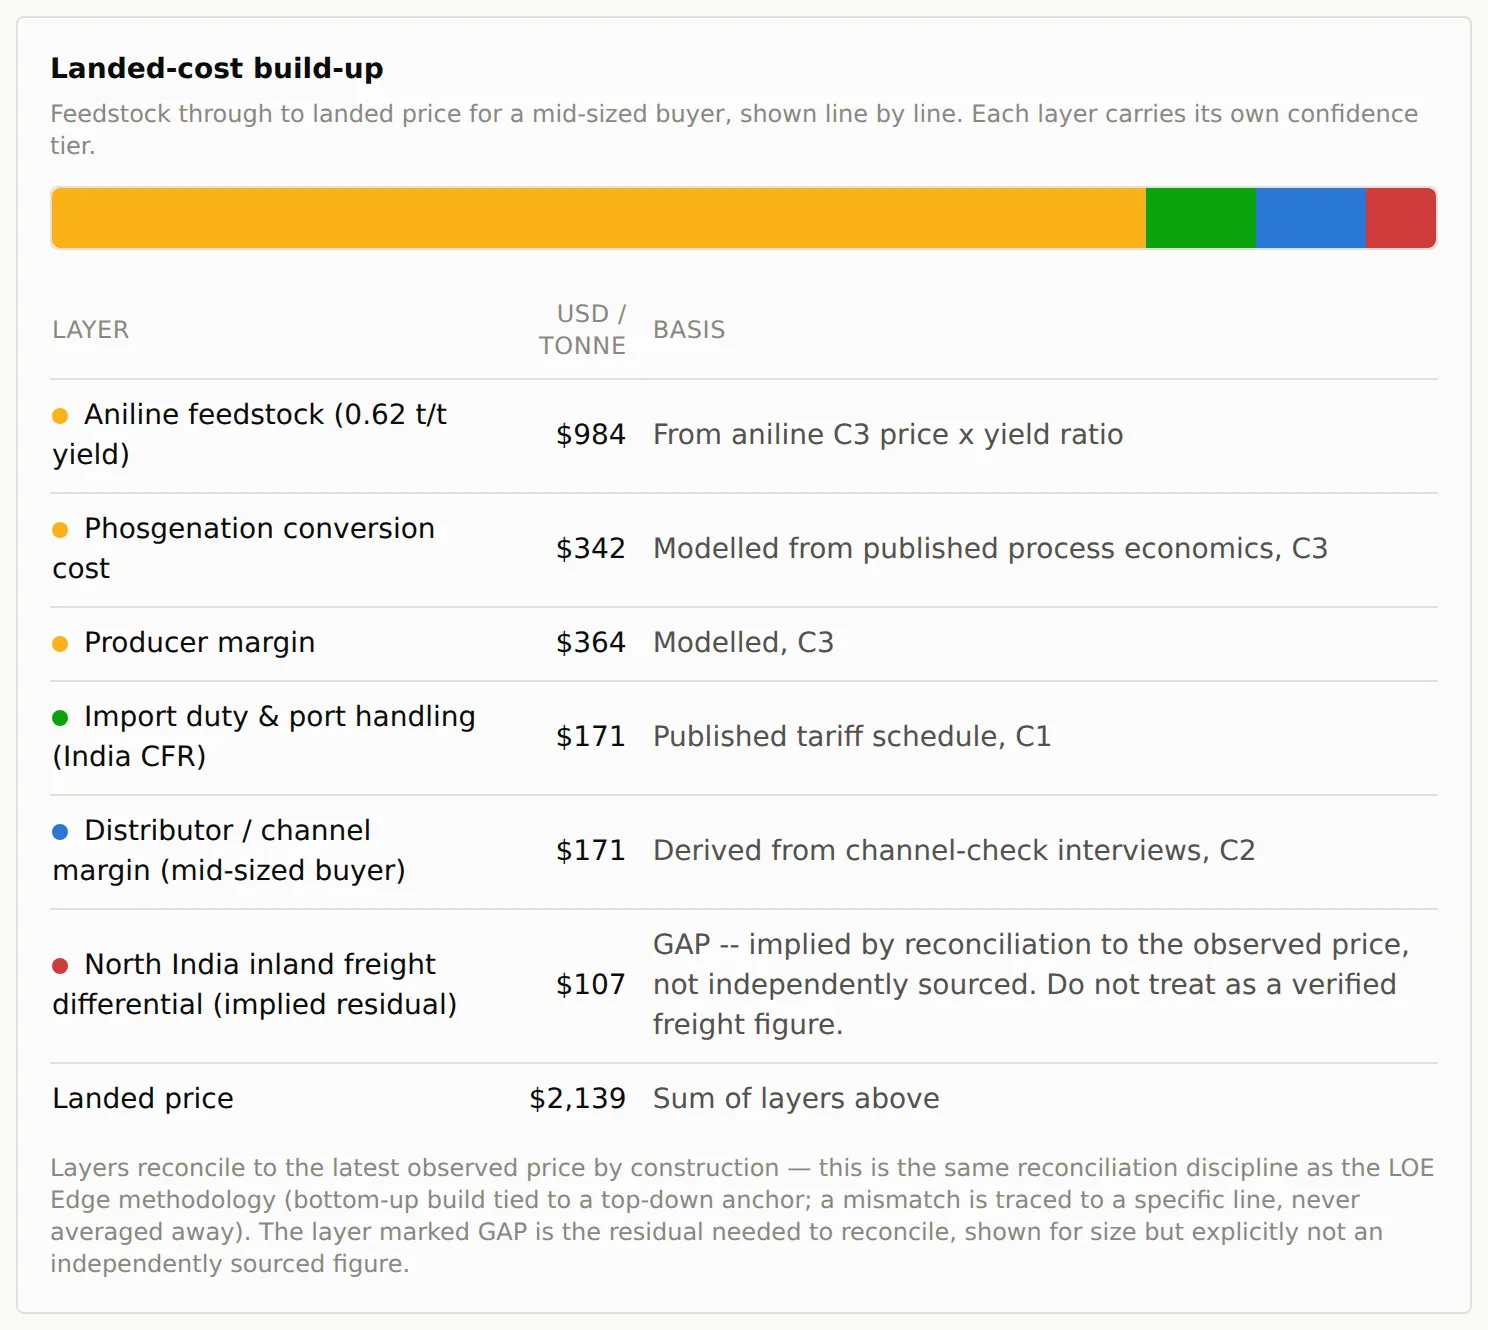
Polymeric MDI feeds foam, insulation panel, footwear and adhesives makers, most of them mid-sized buyers who cannot see how a quote breaks down.
The build-up runs from aniline feedstock through phosgenation, producer margin, import duty and distributor margin to the landed price. One line, the inland freight differential to North India, has no reliable public source. Rather than assume it matches the west coast figure, we show it as an implied residual: sized so the build-up reconciles, and labelled so nobody mistakes it for a verified number.
That single honest gap tells a buyer more about the rest of the build-up than a clean table would.
Download the MDI sample dossier
PDF, sample data.
Discuss access to Price Fundamentals
Tell us about your team, markets and coverage needs. Contact our sales team to discuss pricing and the right access for you.
Talk to salesCommon questions about Price Fundamentals
What does Price Fundamentals cover?
Initial coverage follows the petrochemical value chain, from aromatics feedstock through intermediates to specialty products and polymers: benzene, nitrobenzene, aniline, MDI, phenol, BPA, caprolactam and PTA. New chemicals are added on subscriber request.
How is a price built?
Demand is modelled from the application side and supply from capacity and utilisation. Each price is decomposed into feedstock, conversion, margin, duty and freight layers that reconcile to the observed price, and every layer states its basis and confidence tier.
Where does primary data come from?
From interviews with manufacturers, buyers and distributors, alongside published tariff schedules, process economics and trade data. Interview-based inputs are tiered separately from published ones, so you can see which is which.
Do you cover India-specific pricing?
Yes. India is a Tier A market, priced on a landed basis for Indian buyers, including duty and inland freight. Where an inland differential has no reliable source, it is shown as a named gap.
Can we change the forecast assumptions?
Yes. That is the point of the product. Feedstock, conversion, freight and duty, and margin can each be moved, and the landed price recalculates so your team can test its own view.
How often is the data updated?
Update frequency is set per chemical and stated on each chemical view. Some inputs justify weekly tracking, others move quarterly and a weekly series would only add noise.
Suggest a chemical
Tell us what you buy. Requests decide what we add next.
Test it on a chemical you buy
Pick an input your team negotiates on. An analyst will walk through the cost build-up and the forward view with you.